How to assess data quality
This guide covers generating the RABIES data quality reports, using them to decide which scans to keep, and reporting what you did in a publication. For what the reports mean and why they exist, see Data quality assessment.
The guidance below is written for a standard resting-state fMRI design in which you compare network connectivity between subjects or groups. The aim is to identify features of spurious or absent connectivity, remove the scans where those features dominate, and establish whether the remaining issues confound your group statistics.
Generate the reports
Pass --data_diagnosis at the analysis stage. It needs a set of ICA components
via --prior_maps, with the components corresponding to confounds identified
through --prior_confound_idx:
rabies -p MultiProc analysis confound_correction_outputs/ analysis_outputs/ \
  --data_diagnosis \
  --prior_maps melodic_IC.nii.gz \
  --prior_bold_idx 5 12 19 \
  --prior_confound_idx 0 1 2 6 7 8 \
  --DR_ICA
The reports appear in
data_diagnosis_datasink/.
Connectivity can be evaluated for either analysis, or both:
- For dual regression
Dual regression is always run using the full set of components from
--prior_maps, because several report features are derived from the confound components named in--prior_confound_idx. Connectivity itself is evaluated for each network listed in--prior_bold_idx.- For seed-based connectivity
A report is generated for each seed given to
--seed_list. Each seed must be accompanied by a reference network map — a 3D NIfTI file per seed, passed through--seed_prior_list— representing the connectivity expected for the canonical network that seed belongs to.
Classify your group ICA components
Ideally the components come from the dataset you are analysing, derived with group ICA. A pre-computed set for mice is used by default.
Newly generated components must be inspected visually to identify which
correspond to confound sources. Visualise group_melodic.ica/melodic_IC.nii.gz,
or use the FSL report generated automatically in group_melodic.ica/report.
Pass the confound components to --prior_confound_idx and the networks of interest
to --prior_bold_idx.
Tip
Classify conservatively. Not every component needs a label — include only
those with a clear feature delineating a network or a confound. The defaults
for --prior_bold_idx and --prior_confound_idx correspond to the classification
of the pre-computed set, which you can consult as a reference.
For guidance on classifying ICA components in rodents, see [ZGRW15] and [DGregoireDGC24].
Work through the reports
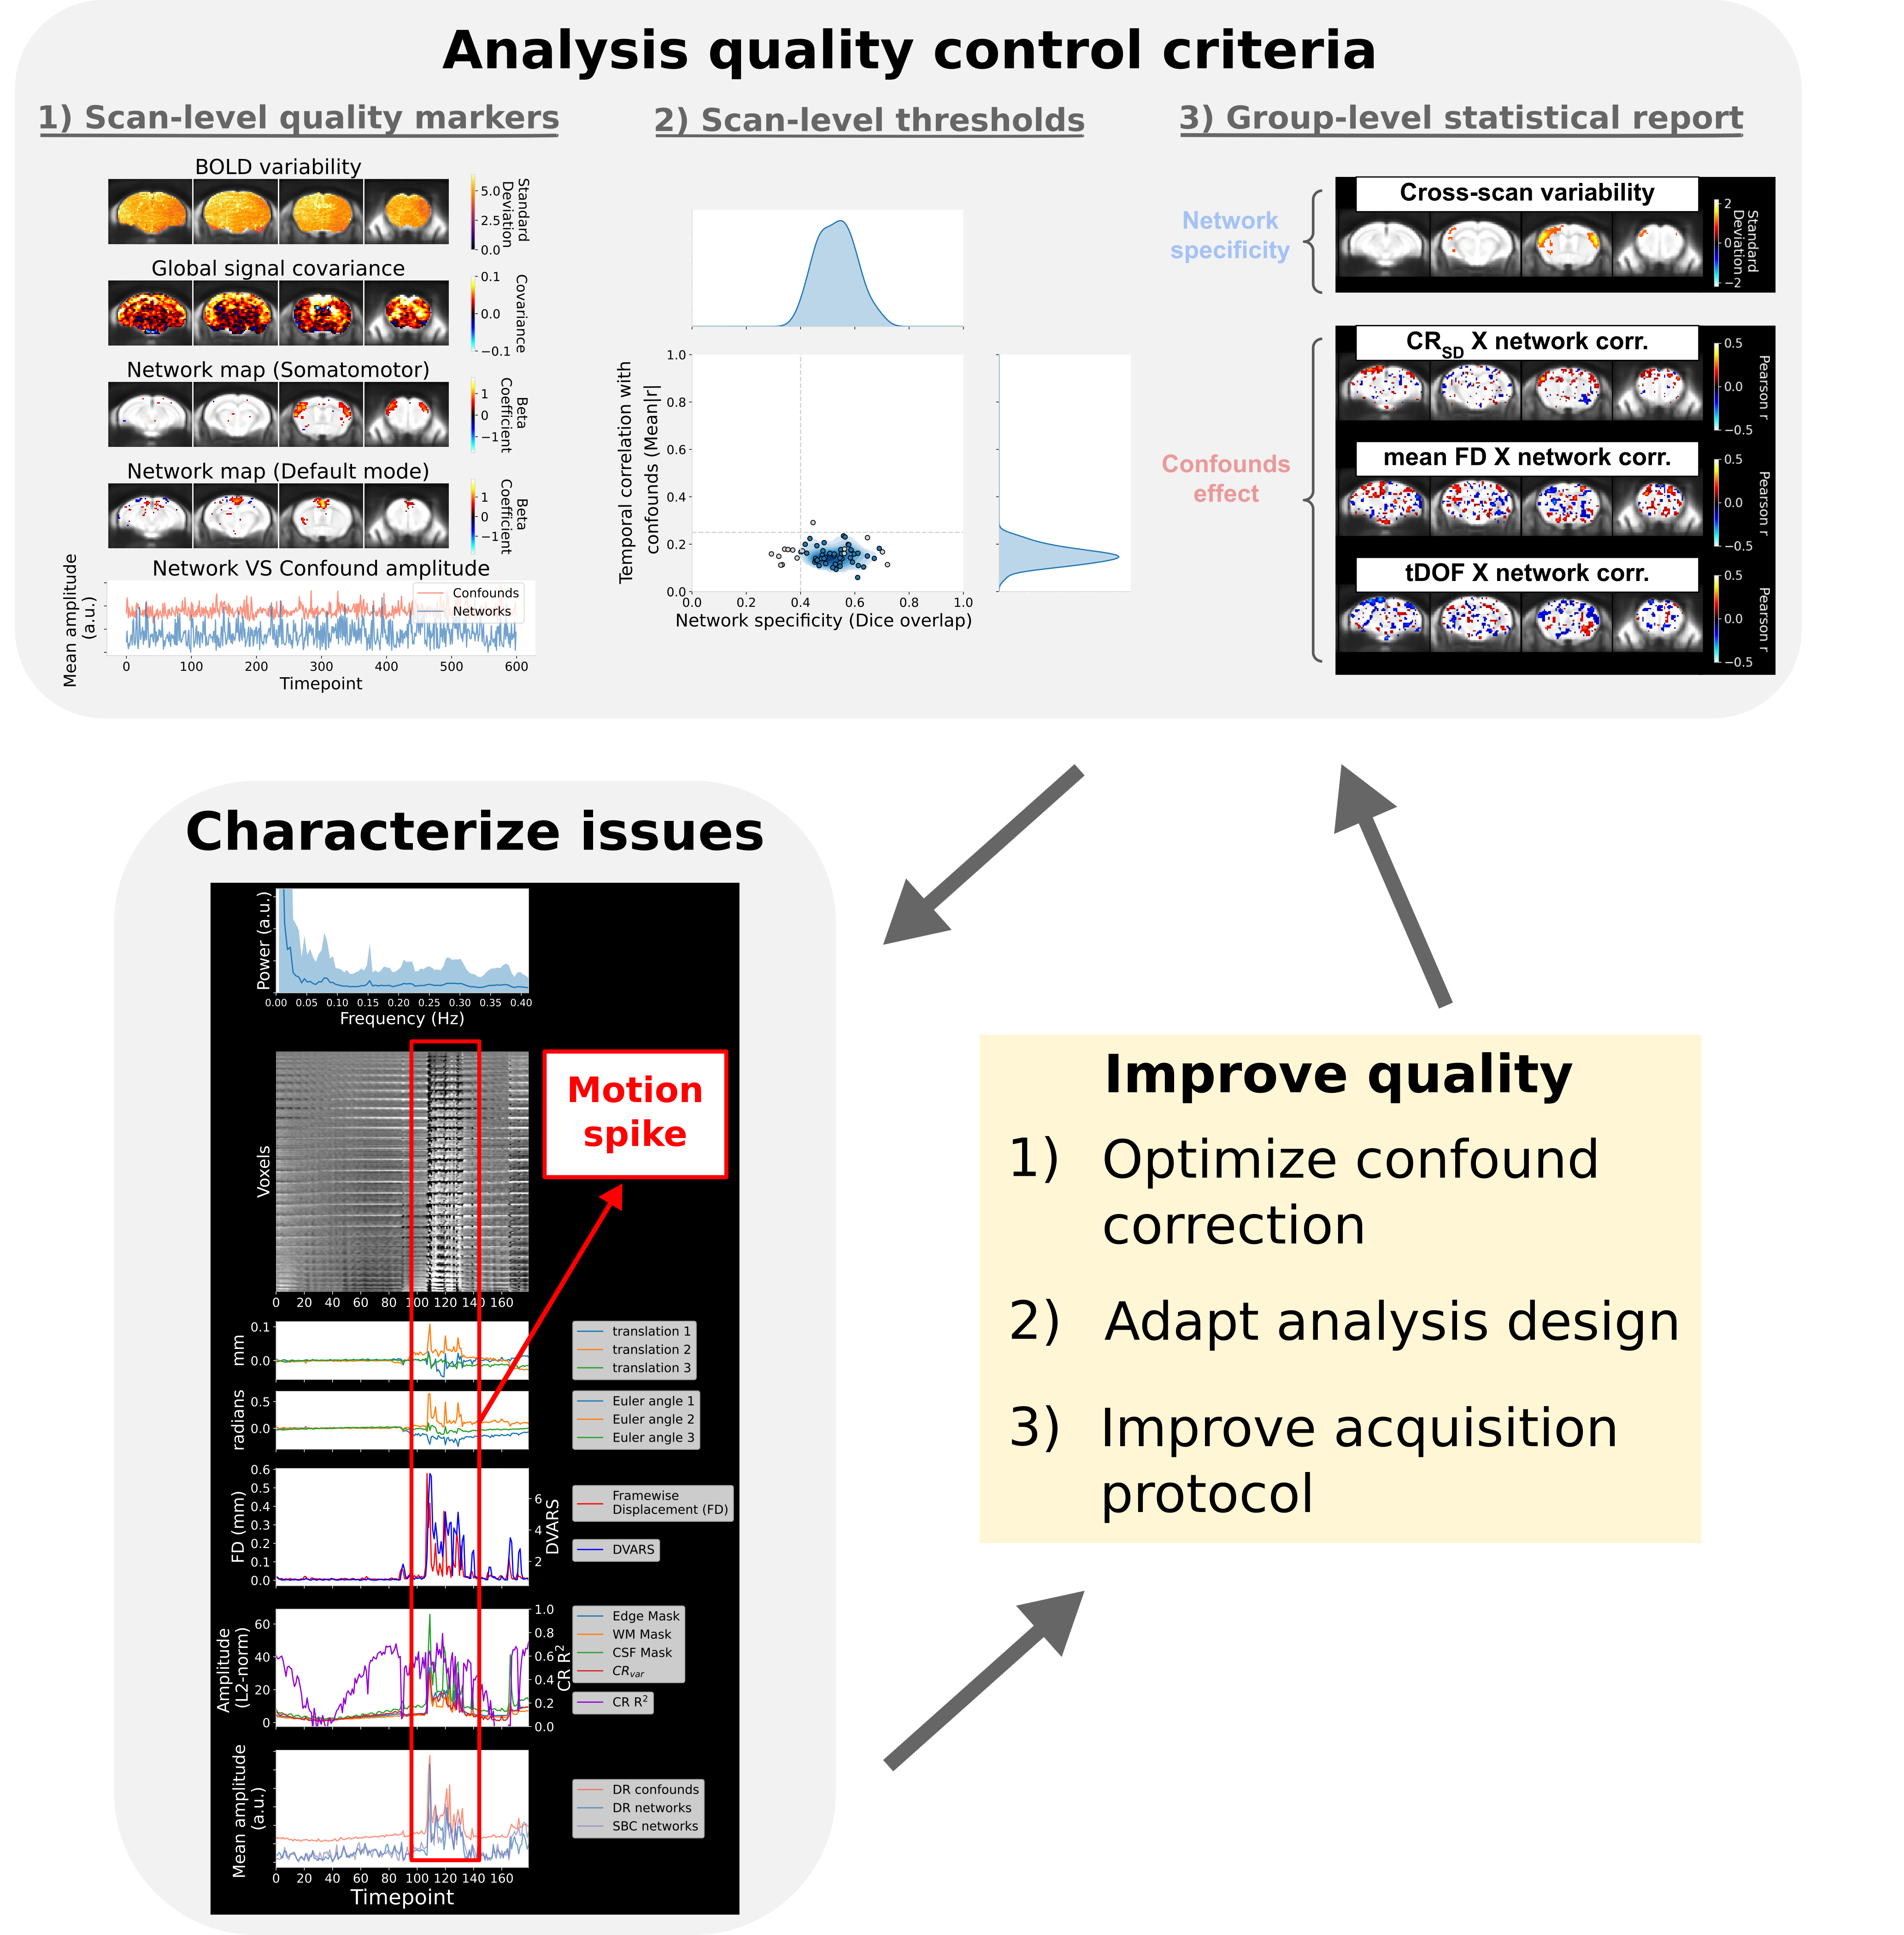
Fig. 7 The quality control framework: scan-level diagnosis feeds scan inclusion decisions, which in turn condition the validity of the group-level report.
1. Inspect each scan
Read the spatiotemporal diagnosis for every scan. Pay particular attention to the four main quality markers that define the categories of scan quality, and judge whether features of spurious or absent connectivity are prominent.
2. Remove scans with spurious or absent connectivity
If those features are prominent in a subset of scans, remove those scans to
mitigate false results. Set thresholds with --scan_QC_thresholds on the
scan-level measures of network specificity and confound correlation:
rabies -p MultiProc analysis confound_correction_outputs/ analysis_outputs/ \
  --data_diagnosis \
  --prior_maps melodic_IC.nii.gz \
  --prior_bold_idx 5 12 19 --prior_confound_idx 0 1 2 6 7 8 --DR_ICA \
  --scan_QC_thresholds '{DR:{Dice:[0.3,0.3,0.3],Conf:[0.25,0.25,0.25],Amp:false}}'
The value is a dictionary expression, quoted so the shell leaves it alone. Per
analysis (DR, SBC or NPR) you can set:
DiceMinimum network detectability, as Dice overlap with the prior. A list of values between 0 and 1, matched in order to
--prior_bold_idxfor DR and NPR, or to--seed_listfor SBC. Either give an empty list, or give exactly as many thresholds as there are networks.ConfMaximum temporal correlation with the dual regression confound timecourses. Same list rules as
Dice.Amptrueto automatically remove scans with outlier network amplitude, which can indicate spurious connectivity [NSOngurB17].
Sensible threshold values should be selected by relating scans flagged in
step 1 (i.e. those that present spurious/absent features in the spatiotemporal diagnosis)
to their associated Dice/Conf values listed in the distribution plots
and the accompanying CSV file, which gives the measures per scan ID.
We do not recommend blindly applying a threshold value listed in a previous
publication, as legitimate Dice/Conf values will differ depending
on the image signal-to-noise ratio and/or preprocessing decision
(e.g. applying a lowpass filter will systematically increase Conf values).
Important
Scans excluded by --scan_QC_thresholds are excluded from the group
statistical report, so it is best to regenerate these reports after
you set the thresholds.
3. Check the group level
Consult the group statistical report to identify the main driver of connectivity variability across scans, and whether there are systematic group-level associations with confound metrics.
4. Revisit confound correction if needed
If significant issues remain, consider redesigning the confound correction stage — see How to optimise your confound correction strategy.
These guidelines are not prescriptive
They are meant to support identifying analysis pitfalls and improving research transparency. The judgement of the experimenter is paramount: network detectability is not always expected, for instance when studying the impact of anaesthesia or inspecting a visual network in blind subjects. The conversation about what should constitute proper standards for resting-state fMRI is still evolving.
Report your quality control in a publication
A central motivation for implementing these automatically-generated quality reports is to encourage and improve scientific transparency and study comparison. Every figure in the report is generated as PNG or SVG and can be shared alongside a publication.
We specifically recommend sharing:
The spatiotemporal diagnosis report from each scan used to derive connectivity results.
A group statistical report and its affiliated distribution plot, for each group or dataset, if the analysis compares connectivity across subjects and/or groups.
The set of ICA components classified as networks and confounds — for example the
melodic_IC.nii.gzfile, with its component classification.
If you excluded scans based on the guidelines above, describe the observations
that motivated your criteria and make the associated reports accessible: the
spatiotemporal diagnoses for the scans that displayed spurious or absent
connectivity and motivated a particular --scan_QC_thresholds value. If you
designed your confound correction using these tools, report that too.
See also
Data quality assessment — what these reports are for
Metric definitions — how every quantity is computed
Analysis outputs — where each file lands