Overview of data quality assessment
Data quality can have serious impacts on analysis outcomes, leading to false findings. Rodent imaging can suffer from spurious effects on connectivity measures if potential confounds are not well accounted for, and acquisition factors such as anaesthesia level can themselves influence network activity [DGregoireDGC24, GCA+20].
To support interpretability, troubleshooting and reproducible research, RABIES includes a set of reports for assessing data quality in individual scans and for conducting quality control before network analysis at the group level. The reports are designed to evaluate two main aspects: whether canonical brain networks are detectable, and how far potential confounds — motion, physiological instabilities, and others — have influenced the result.
Where the practical instructions live
This page explains what the reports are and how they relate to one another. For how to generate them, set inclusion thresholds and report your quality control in a publication, see How to assess data quality.
The three reports
The reports are generated by --data_diagnosis at the analysis stage, into
data_diagnosis_datasink/. Each provides a
complementary review of the data.
Qualitative, per scan. Regroups temporal and spatial features that characterise the specific origin of a quality issue.
Quantitative, across the dataset. Shows where each scan falls on measures of network specificity, network amplitude and confounds — which is how outliers become visible.
Group level, per network. Brain maps of cross-scan variability in connectivity, and the group-wise correlation between connectivity and confounds.
Why three levels
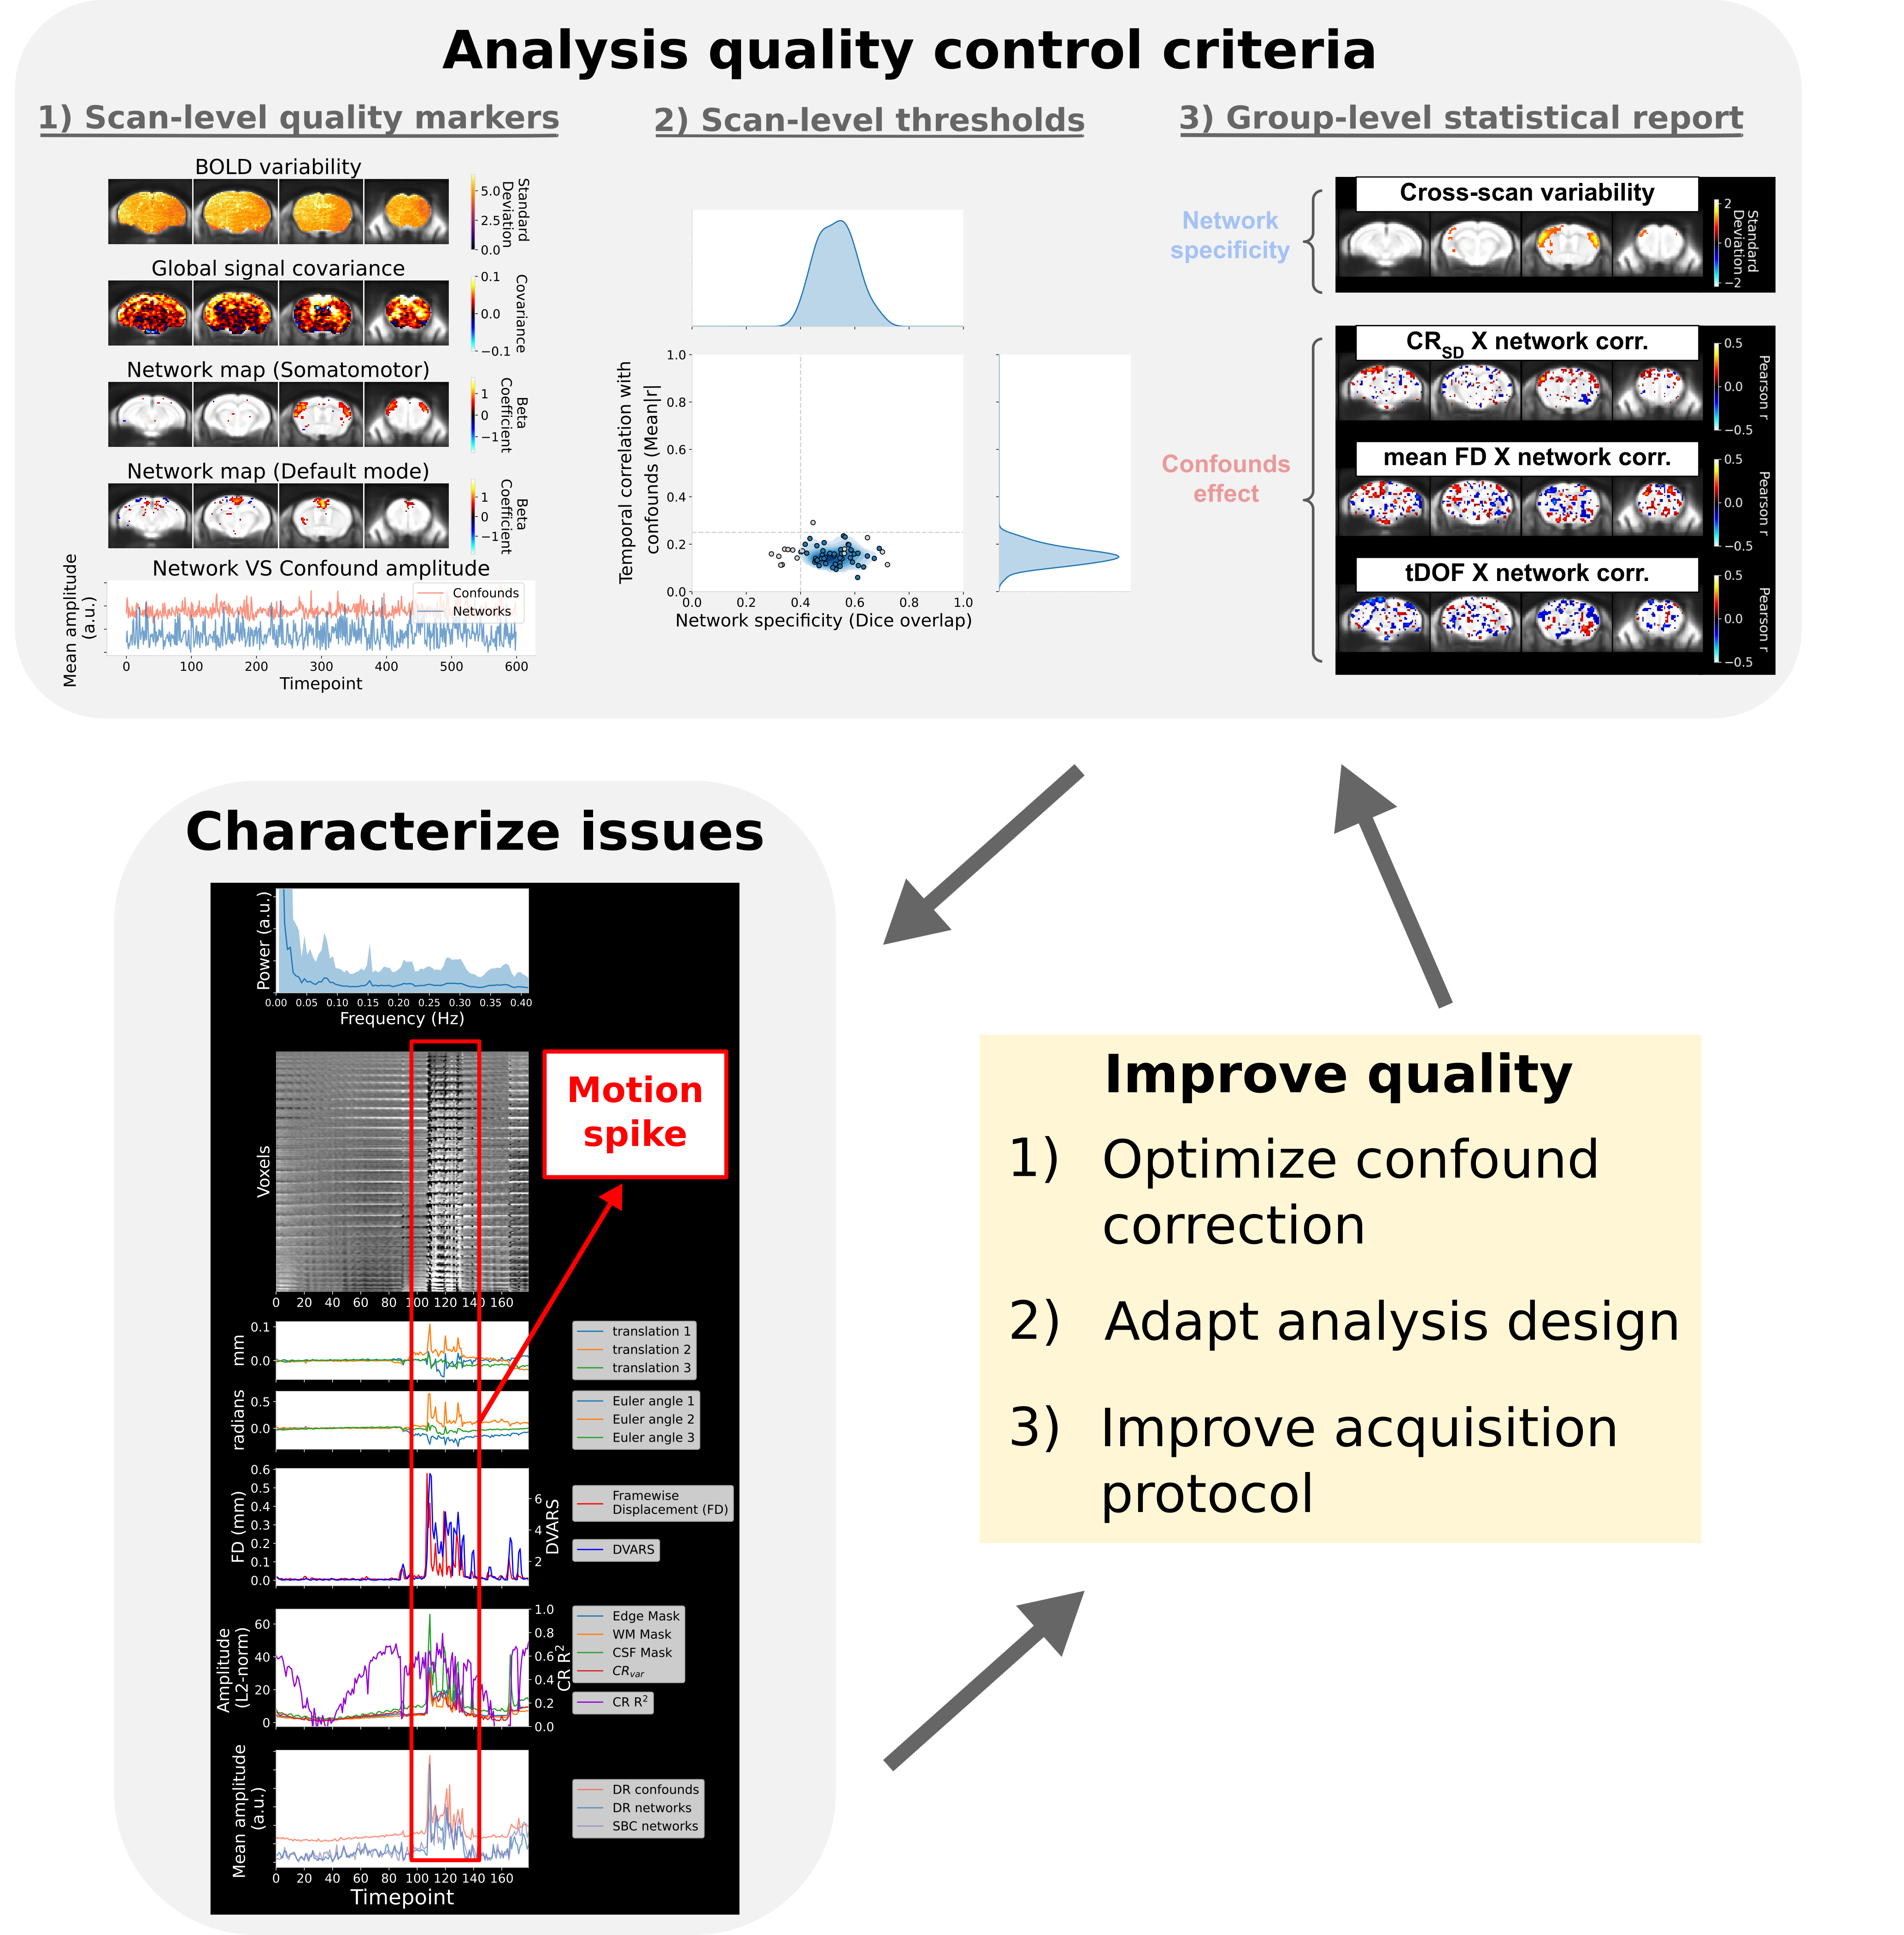
Fig. 18 The quality control framework. Each level conditions the validity of the next.
The three reports are not alternatives; they answer different questions, and they depend on each other in one direction.
The spatiotemporal diagnosis can help you flag most specifically what is wrong with an individual scan — whether the signal variability carries an anatomical confound signature, whether the network is present at all, whether network and confound timecourses move together. It identifies the type of problem, which can make a targeted correction possible.
The QC-FC distribution plots turn those qualitative judgements into numbers you can survey across the whole dataset. Doing so enables outlier detection, setting exclusion thresholds, and detecting subtle but systematic relationships between confounds and network measures across samples (i.e. QC-FC relationships).
The group statistical report asks the question that actually matters for common group statistical designs: is the variability in connectivity across scans driven by network activity, or by confounds? Scan-level features being acceptable does not by itself guarantee this.
That last report depends on the first two. Either an absence of network activity or spurious effects in a subset of scans can drive apparent network variability, because there will be differences in the presence versus absence of the network across scans — differences actually driven by data quality divergences rather than by biology. This is why scan-level assumptions have to be met before the group-level report means anything.
A note on judgement
These reports and the guidelines built around them aim to identify analysis pitfalls and improve research transparency. They are not meant to be prescriptive.
The judgement of the experimenter is paramount in adopting adequate practices. Network detectability is not always expected — not when studying the impact of anaesthesia, nor when inspecting a visual network in blind subjects. The conversation about what should constitute proper standards for resting-state fMRI is still evolving, and these tools are a contribution to it rather than a settlement of it.