QC-FC distribution
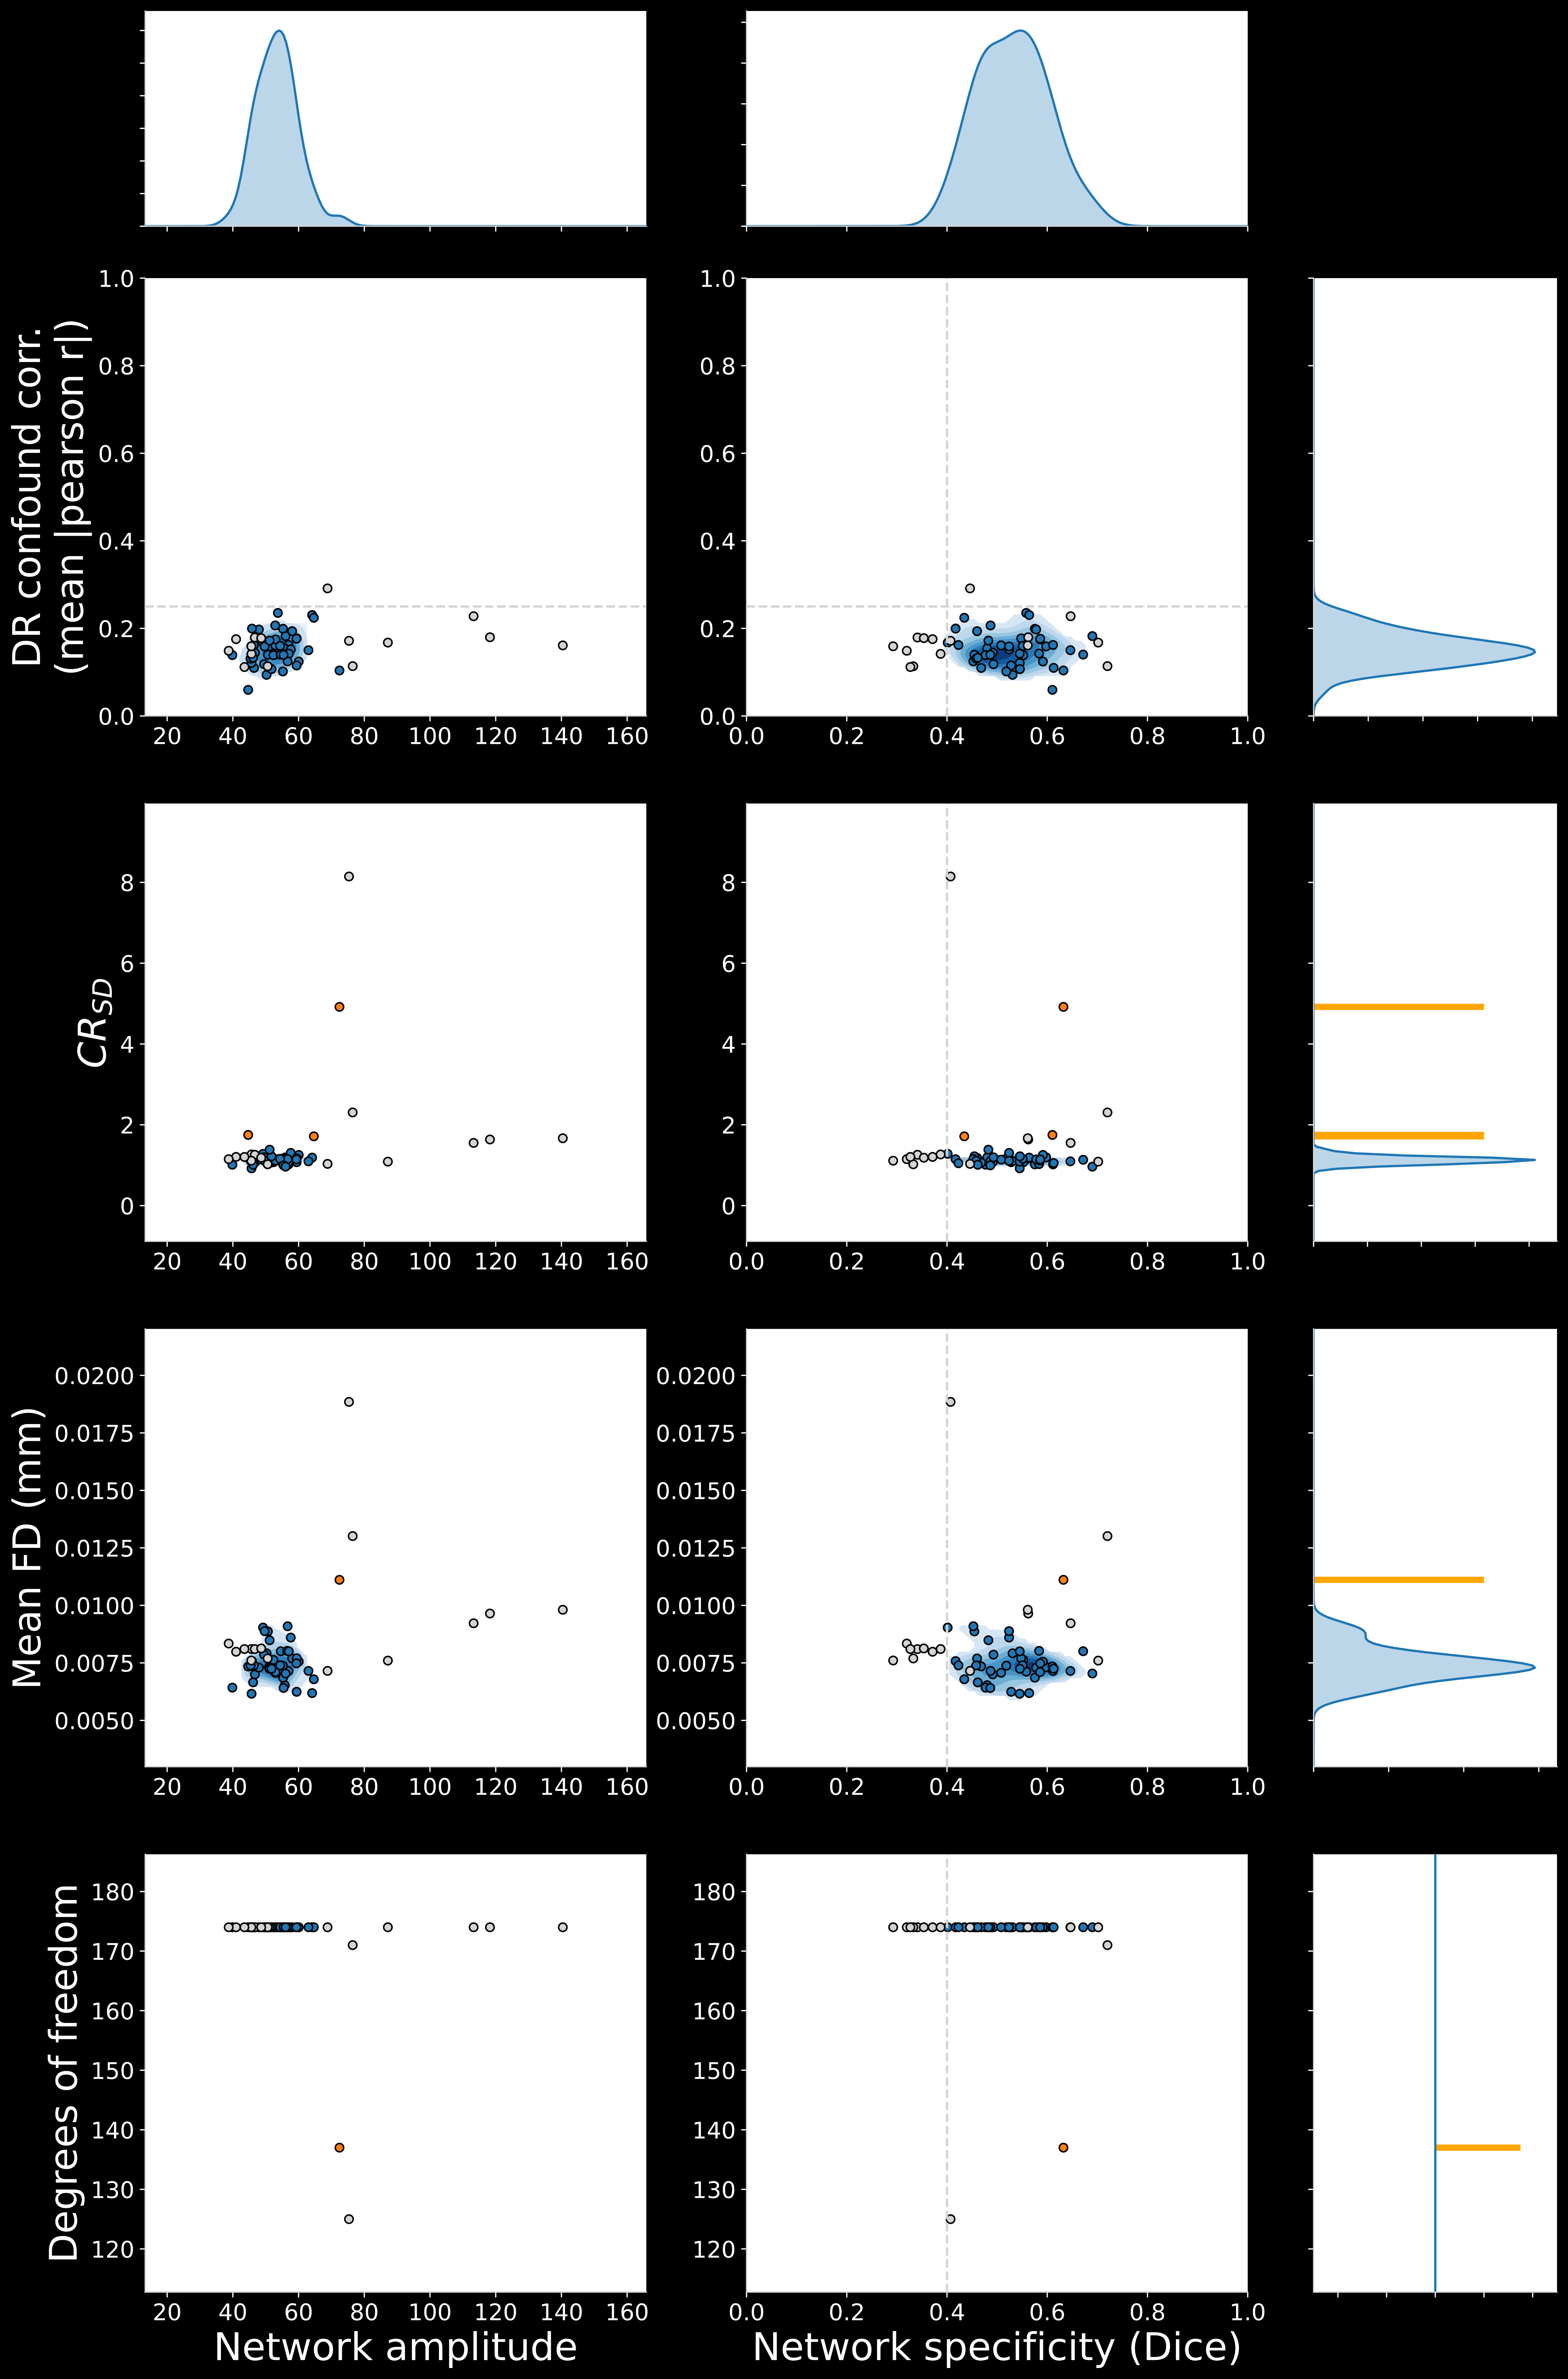
Fig. 21 Each point is a scan. Measures of network connectivity — specificity and amplitude — are contrasted with measures of confounds across the sample.
The QC-FC distribution plot visualises the joint distributions of network and confound data quality measures across the dataset, extending the per-scan qualitative judgements from the spatiotemporal diagnosis into a quantitative comparison between subjects.
Reading the plot:
Points labelled in grey were removed using
--scan_QC_thresholds. The grey dotted lines are the QC thresholds selected for network specificity (Dice overlap) and DR confound correlation.Among the remaining samples, and for each metric separately, scans presenting outlier values are labelled in orange. Outliers are detected with a modified Z-score threshold, set by
--outlier_thresholdand 3.5 by default.
The derivation of each quality metric is described in the metric definitions.
What the report is for
Identify systematic QC-FC associations at the dataset-level. Visualise the association between network (specificity and amplitude) and a set of scan-level summary confound measures (the columns in the plot). This complements the group statistical report by indicating whether a group-wise correlation in the report is driven by a small number of outliers rather than by a dataset-wide effect.
Setting scan inclusion criteria. Inspect that network specificity is
sufficient and that the temporal correlation with confounds (DR confound corr.)
is minimal, then set thresholds for scan inclusion with --scan_QC_thresholds.
This is the top right subplot, discussed below.
See also
How to assess data quality gives the
--scan_QC_thresholds syntax and the procedure for choosing values.
Inclusion criteria exemplified
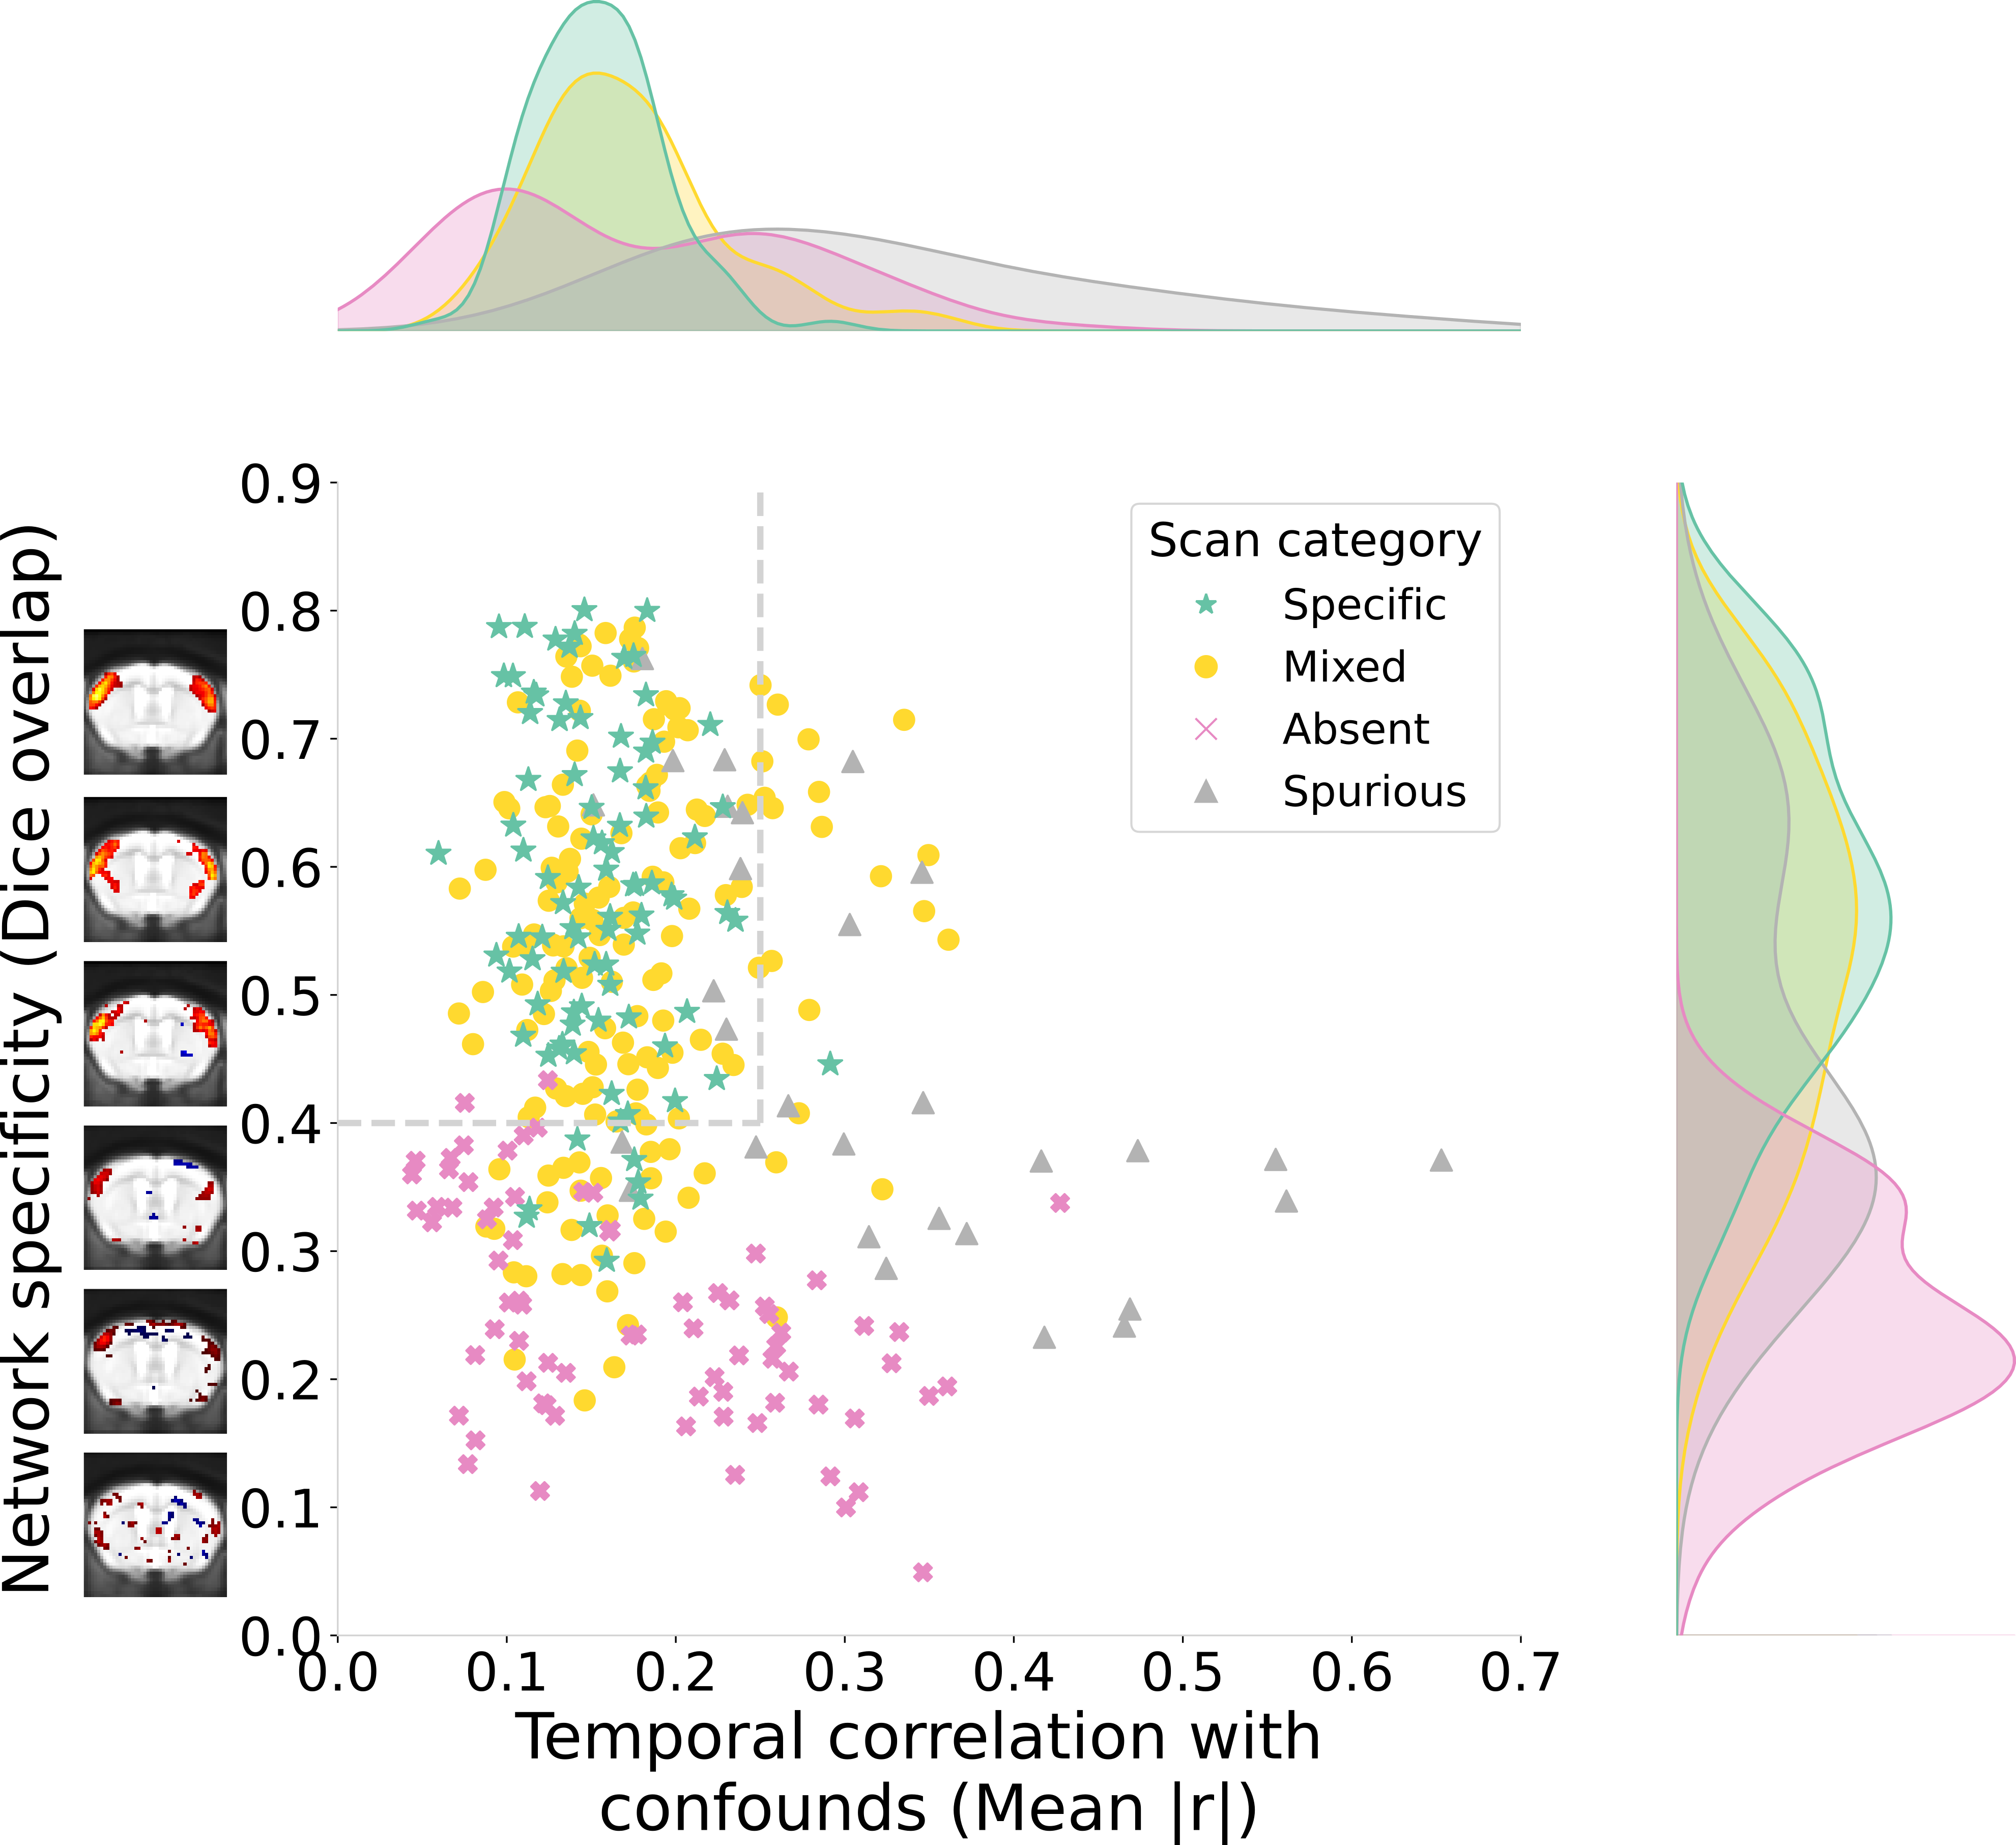
Fig. 22 Reproduced from [DGregoireDGC24]: how the categories of scan quality outcome separate along these two measures.
The measures of network specificity (Dice overlap) and temporal correlation
with confounds — where confound timecourses are extracted using the confound
components specified with --prior_confound_idx and measured through dual
regression — were defined in [DGregoireDGC24] for conducting
scan-level QC.
They were selected as the measures best suited to quantifying network detectability and spurious connectivity, and to applying inclusion thresholds that select scans respecting the assumptions of network detectability and minimal confound effects.