The group statistical report
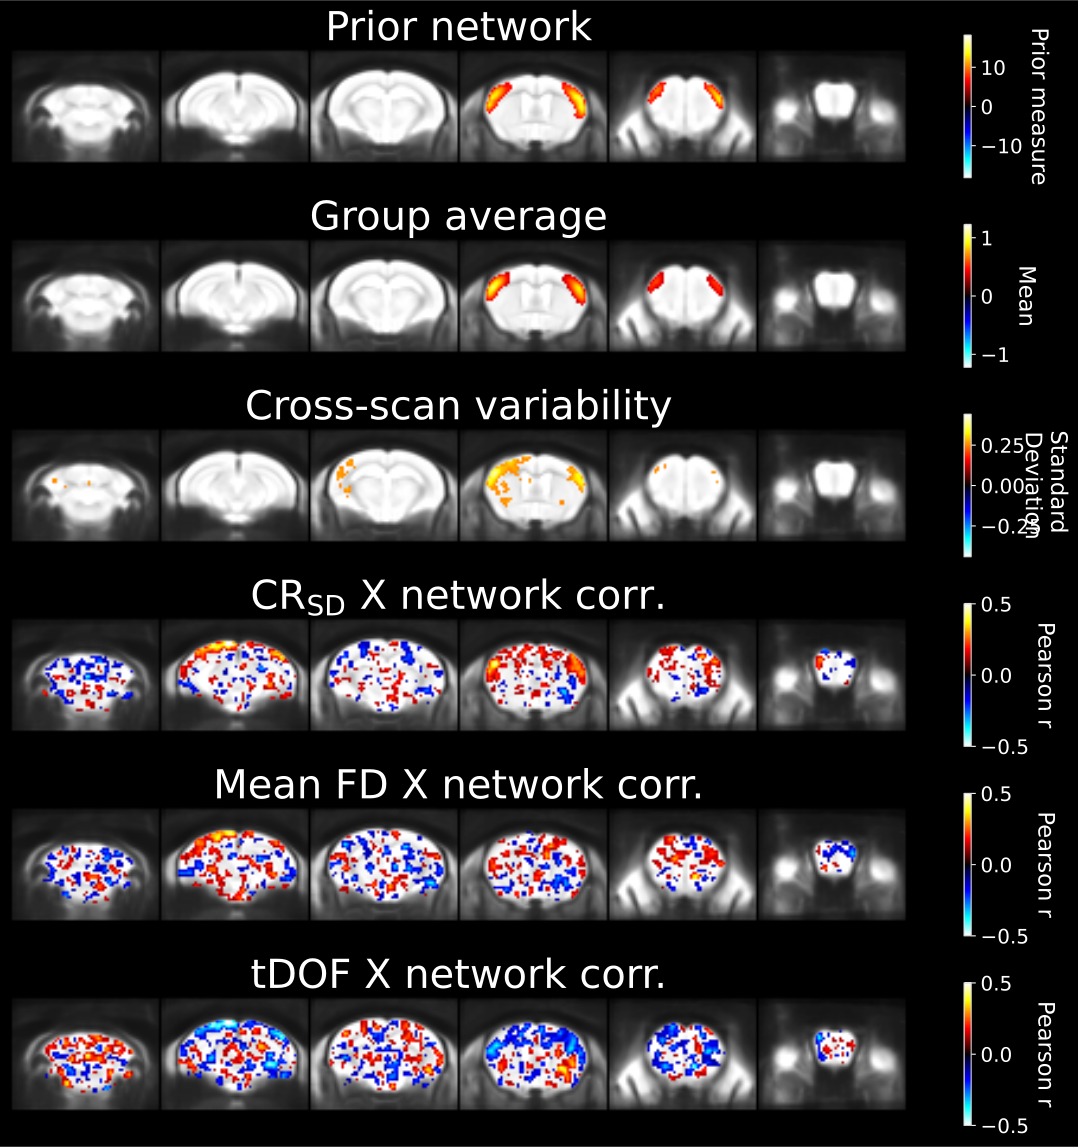
Fig. 23 Group-level features of connectivity variability, for the mouse somatomotor network.
Inspecting scan-level features is not sufficient to conclude that inter-scan variability in connectivity is itself unaffected — there can be subtle but systematic artefactual effects that impact that variability without being easily detected from the dataset average or individual maps. This variability is the primary driver of results in conventional group statistical designs (e.g. comparing two different experimental groups), in which case it is important to also assess these additional aspects of data quality.
Specificity of network variability
The standard deviation in connectivity across scans is computed voxelwise, which visualises the spatial contrast of network variability.
If that variability is primarily driven by network connectivity, the contrast should reflect the anatomical extent of the network of interest, as in the example above for the mouse somatomotor network. Otherwise it may display spurious or absent features. For more on the development of this metric, consult [DGregoireDGC24].
Note
The contrast depends on sample size. [DGregoireDGC24] demonstrate this directly. If network connectivity is observed in individual scans but not in this statistical report, increasing the sample size may improve the contrast.
Correlation with confounds
Connectivity is correlated across subjects, at each voxel, with each of the confound measures listed in the metric definitions. This establishes how strongly connectivity is associated with potential confounds. What constitutes a concerning correlation depends on the study and on the effect size of interest: the question to ask is whether the effect size you are looking for is much larger than the effect size of the confounds, or comparable to it.
The quantitative CSV report
A CSV file is generated alongside the figure, recording a quantitative assessment of both aspects. The overlap between the network variability map and the reference network map is measured using Dice overlap; for the confound measures, the mean correlation is measured within the area of the network. See the group QC metric definitions.
Important
The validity of this report depends on whether the scan-level assumptions of network detectability and minimal confound effects are met.
Either a lack of network activity or spurious effects in a subset of scans can drive apparent network variability, because there will be differences in the presence versus absence of the network across scans — but those differences would be driven by data quality divergences rather than by biology.
See also
How to assess data quality — the full quality control workflow this report sits at the end of.